Death? Why this fuss about death? Use your imagination, try to visualize a world without death! Death is the essential condition of life, not an evil.
Visualisers
Visualisers are routines that show a certain aspect of an object that is not normally seen, but helps you to design, troubleshoot, and 'visualise' things more clearly during the design stage.
ShowCurve()
ShowCurve(Array,Radius,Frac=1,Connect=true,Closed=false)
| Array |
Array, array of curve vertices. |
| Radius |
Scalar, radial dimension (thickness) of the curve 'line'. |
| Frac |
Fraction of the curve to visualise, e.g., 0.5 for half the curve. |
| Connect |
Boolean, connect the vertices if true. |
| Closed |
Boolean, the curve is 'closed' or circular, i.e., connect Array[N] to Array[0] if true. |
Useful for troubleshooting
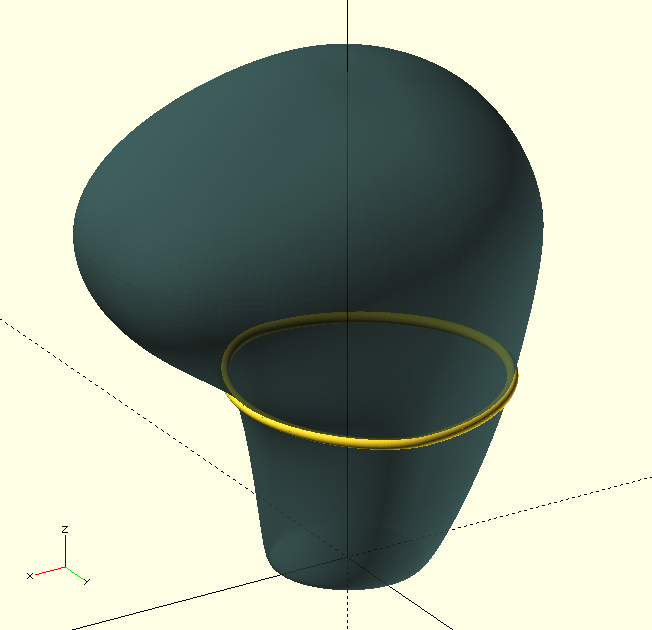
Bézier Curves and such things, ShowCurve() does exactly what it says on the tin: it allows you to visualise a curve consisting of an array of vertices.
ShowFx()
ShowFx(Domain=[0,1],Resolution=100,DotSize=0.05,GPLFactor=100)
| Domain |
Tuple, minimum and maximum values of the domain of the function. |
| Resolution |
Integer, number of points of the displayed function across the domain. |
| Dotsize |
Scalar, size of the displayed function points. |
| GPLFactor |
Scalar, the |
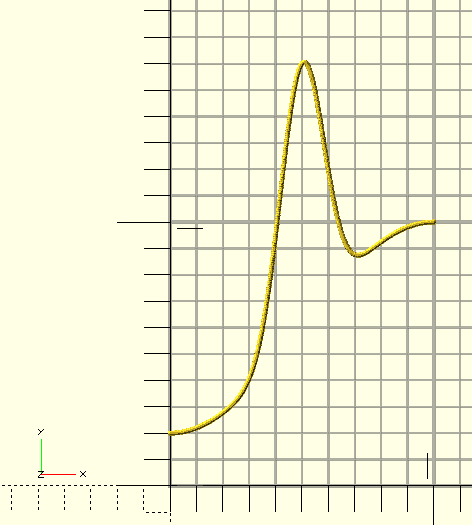
Display a function with a 'graph-paper' background. ShowFx() expects a function with the name Fx to be declared in the top-level name-space, and the declaration must be similar to the example below.
GPLFactor is a requirement for the GraphPaper() module which compensates the line thickness for View-Point distance ($vpd) but it needs a refreshed preview or render after every zoom operation to do so. Higher values yield thinner lines.
function Fx(X)=
    0.8*pow(sin(X*90),2)
    +1*pow(sin(X*180),20)
;

ShowFx(Domain=[0,1],Resolution=700,DotSize=0.015,GPLFactor=100);
ShowSlice()
ShowSlice(TX,TY,TZ,RX,RY,RZ,Thickness,Children,
SliceColor,SliceAlpha,ChildColor,ChildAlpha)
| TX, TY, TZ |
Scalars, translation of the slice. |
| RX, RY, RZ |
Scalars, rotation of the slice. |
| Thickness |
Scalar, thickness of the slice. |
| Children |
Boolean, display |
| SliceColor, SliceAlpha, ChildColor, ChildAlpha |
OpenSCAD color parameters. |
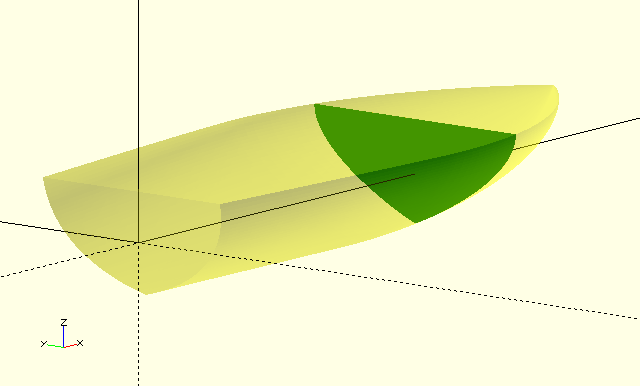
Display a slice through Children(). The 'slice' is generated in the X-Y plane, and rotated and translated into position to show the desired features of Children() Only the relevant translations and rotations need to be specified. With the default settings, Children() will be displayed transparently, however color and alpha parameters are supplied to influence this behaviour. Useful for troubleshooting new forms, and visualising intermediate cross-sections of Bézier polyhedrons during the design phase.
ShowVertex()
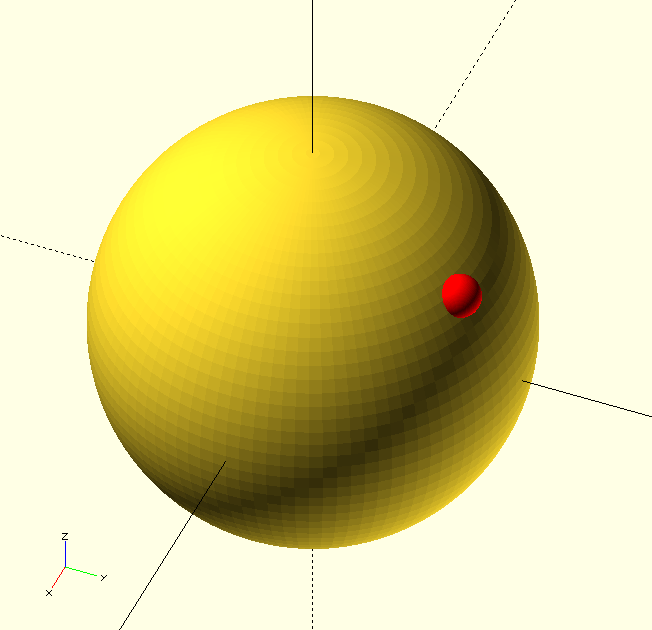
ShowVertex(Vertex,Radius=0.5,Color=RED)
| Vertex |
Vertex to be highlighted, probably a vertex from an array like |
| Radius |
Scalar, radius of the shere highlighting Vertex. |
| Color |
OpenSCAD color. |
ShowVertex() is used to highlight a single vertex in a curve and is just shorthand for translate(Vertex)sphere(r=Radius);. It is useful for debugging curves and shapes.
ShowVertices()
ShowVertices(Array,Vertices=undef,Radius=0.5,Color=RED)
| Array |
Array of vertices, probably a curve or similar. |
| Vertices |
Vertices to be highlighted. Accepts any OpenSCAD range format like |
| Radius |
Scalar, radius of the shere highlighting Vertices. |
| Color |
OpenSCAD color. |
Like ShowVertex() but for a range or selection of vertices from an array.